Series 02 · 20 lessons · 3 h 14 min
SmartPLS 4: Practical SEM Course
Learn SmartPLS 4 through real software demonstrations, survey data and research papers. We build a model, compare PLS, PLSc and CB-SEM, and check what the results can and cannot tell us. With Ali Safari.
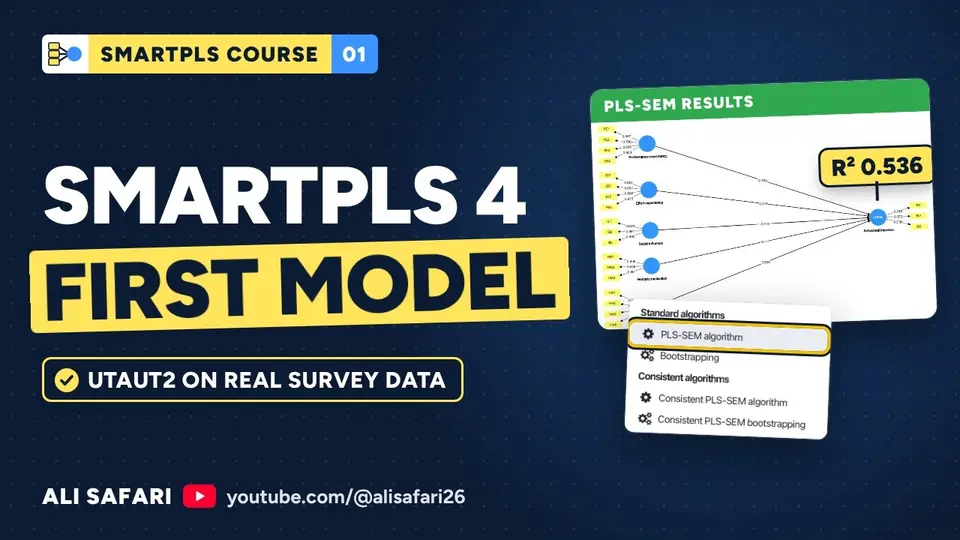 9:44Play SmartPLS 4 Tutorial: Build Your First PLS-SEM Model | Lesson 1
Lessons
Watch in order.
 9:4401SmartPLS 4 Tutorial: Build Your First PLS-SEM Model | Lesson 1
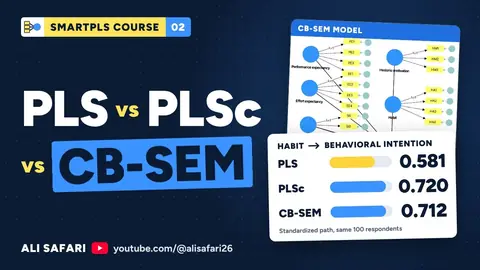 12:5302PLS-SEM vs PLSc vs CB-SEM in SmartPLS 4 | Lesson 2
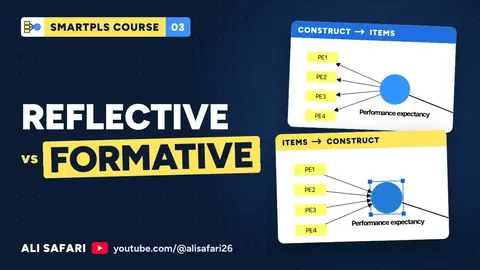 13:3103Reflective vs Formative Measurement Models in SmartPLS 4 | Lesson 3
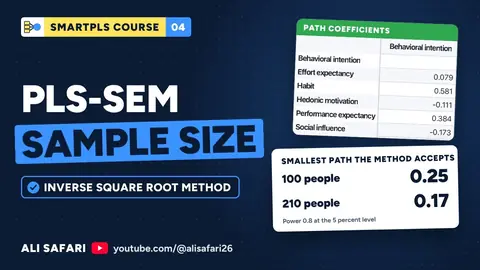 13:5104PLS-SEM Sample Size: How Many Respondents Do You Need? | SmartPLS 4 Lesson 4
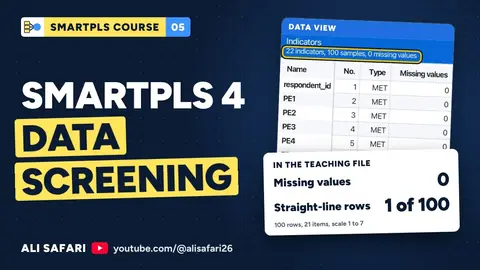 11:0605SmartPLS 4 Data Screening: Missing Values & Straightlining | Lesson 5
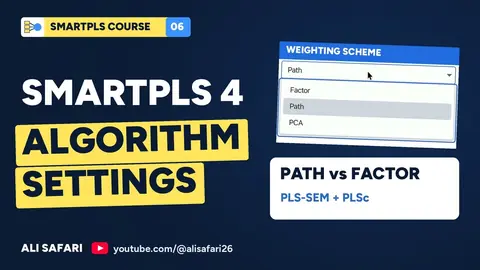 8:3406SmartPLS 4 Algorithm Settings: Path vs Factor Weighting | Lesson 6
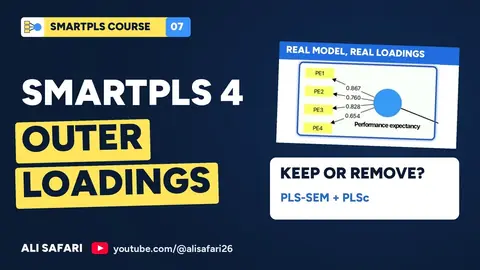 9:3107SmartPLS 4 Outer Loadings: When Should You Remove an Item? | Lesson 7
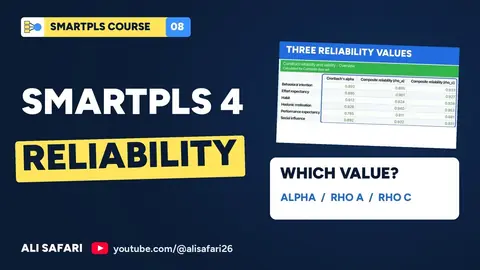 8:5008SmartPLS 4 Reliability: Cronbach's Alpha, rho A and rho C | Lesson 8
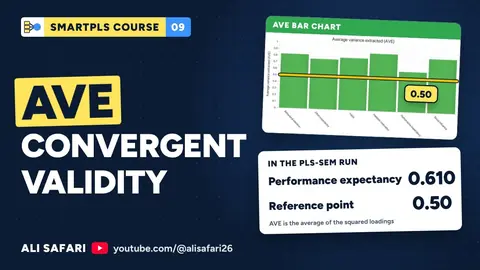 8:1709SmartPLS 4 AVE: How to Check Convergent Validity | Lesson 9
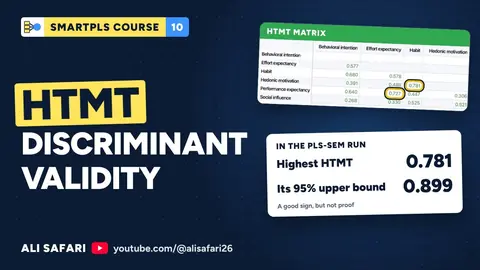 10:5910SmartPLS 4 HTMT: Discriminant Validity and Bootstrap Intervals | Lesson 10
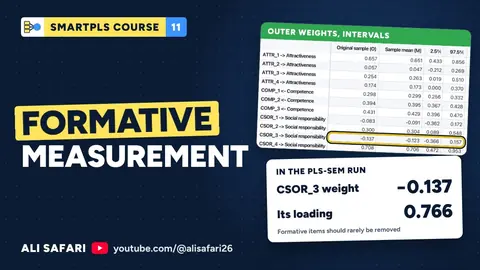 6:4411Formative Measurement in SmartPLS 4: Weights, Loadings and VIF | Lesson 11
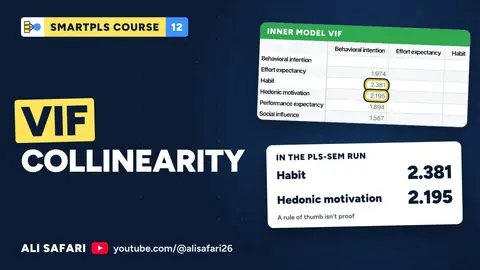 7:5512Collinearity and VIF in SmartPLS 4 | Lesson 12
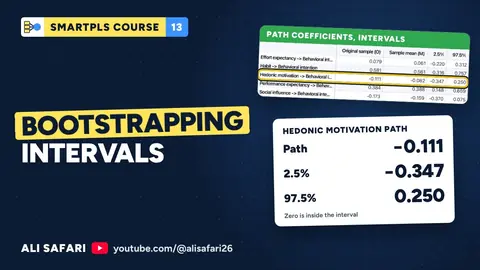 8:3113Bootstrapping in SmartPLS 4: p Values and Confidence Intervals | Lesson 13
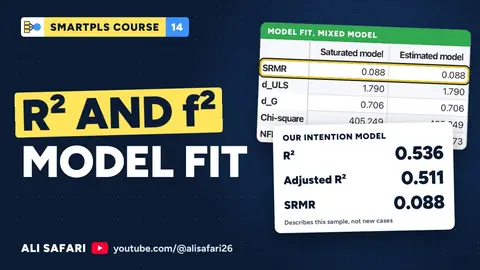 9:3114SmartPLS 4 Model Fit: R², f² and Path Coefficients | Lesson 14
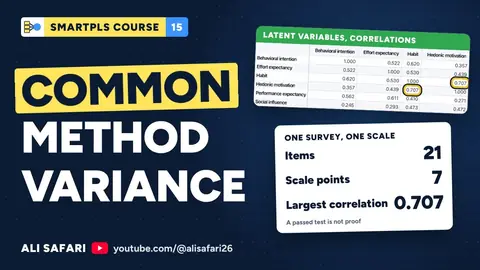 8:2815Common Method Variance in SmartPLS 4: What Can You Check? | Lesson 15
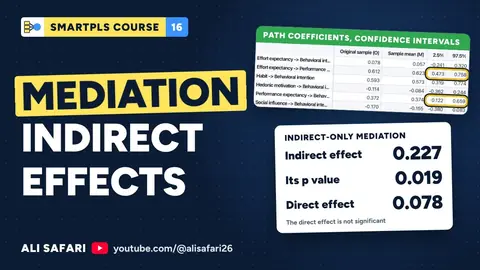 8:4916Mediation in SmartPLS 4: Direct and Indirect Effects | Lesson 16
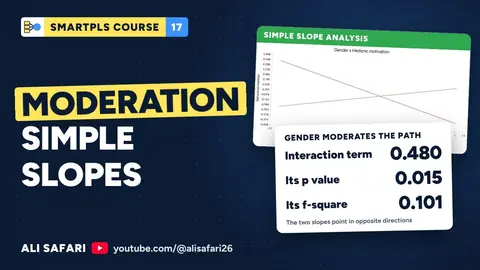 9:5217Moderation in SmartPLS 4: Interaction Effects and Simple Slopes | Lesson 17
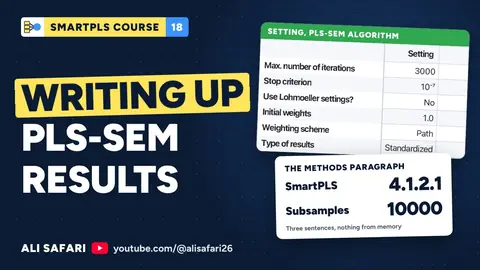 10:3418Writing Up PLS-SEM Results in SmartPLS 4 | Lesson 18
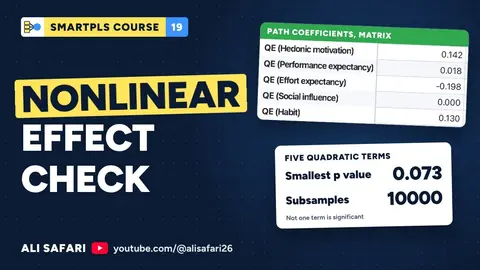 9:3619How to Check Nonlinear Effects in SmartPLS 4 | Lesson 19
 6:1620Reproduce a Full PLS-SEM Project in SmartPLS 4 | Lesson 20
Field Notes
Read alongside.
- PLS vs. CB-SEM: The Statistics Debate That Will Not DieThe debate over which SEM approach to use in IS research has run for decades and produces more heat than light. Here is what actually matters.
- Common Method Bias and Why Your Survey Results Might Be WrongPodsakoff et al. (2003) documented how collecting both variables from the same person at the same time inflates correlations artificially. This is still one of the most cited papers in IS research.
- Measurement Invariance and the Assumption Few Papers TestWhen IS researchers compare survey results across groups, they assume the constructs mean the same thing to everyone. Most papers never test this. The test is called measurement invariance.
- Survey Response Scales and Why Your Five Points Might Not Mean What You ThinkIS survey research defaults to Likert-type scales without much thought. The choices made about scale design shape what respondents report and how results can be analyzed.



If you’re studying IS or CIS, or just starting your own research, I hope you find something here that helps.
Videos play from YouTube once you press play.